The SARC portal
The SARC portal (karc-portal) is the human-facing layer above the Evidence Vault / Fides, ServiceNow, your CI systems, and your cloud. Everything else in SARC is plumbing; the portal is what an operator, compliance officer, and auditor actually look at.
Why the portal exists
Section titled “Why the portal exists”Regulated delivery generates a lot of data in a lot of places:
- Pipeline state lives in GitLab CI / GitHub Actions / Azure DevOps.
- Evidence (SBOMs, SARIF scans, attestations, trails) lives in the Evidence Vault.
- Workflow (change requests, CAB approvals, incidents, CIs) lives in ServiceNow.
- Cost lives in AWS Cost Explorer / Azure Cost Management / GCP Billing.
- Cluster state lives in your AKS / EKS / GKE / k3d / OpenShift control planes.
Each of those is good at its own job. None of them shows you the single story of “what changed, what was the risk, who approved it, where did it deploy, and what’s the audit trail.” The portal is that single story.
It is intentionally not a re-implementation of any of the upstream systems — it composes them.
Who uses the portal
Section titled “Who uses the portal”| Persona | What they do here | Pages they live in |
|---|---|---|
| Compliance / GRC director | Track framework coverage, export evidence packs, answer auditor questions | /compliance, /compliance/evidence, /controls, /audit-log |
| Platform engineer | Triage pipelines, vulns, policy violations; drive ArgoCD syncs | /pipelines, /vulnerabilities, /argocd, /policies |
| Service owner / SRE | Watch incidents on services they own; respond to problem records | /services, /problems, /incidents, /timeline |
| Auditor (time-boxed) | Read-only view of evidence + audit trail for one audit window | /compliance/evidence, /audit-log (magic-link login) |
| CFO / finance partner | Cost roll-up + chargeback + cost-to-fix correlation | /costs, /costs/chargeback |
| Admin / tenant operator | User management, integrations, framework toggle, AI provider | /users, /settings/*, /admin/mcp |
What it looks like
Section titled “What it looks like”For the full categorized walk-through of every screen, see the portal tour. The short version below shows the four most-used surfaces.
import { Aside, CardGrid, Card } from ‘@astrojs/starlight/components’
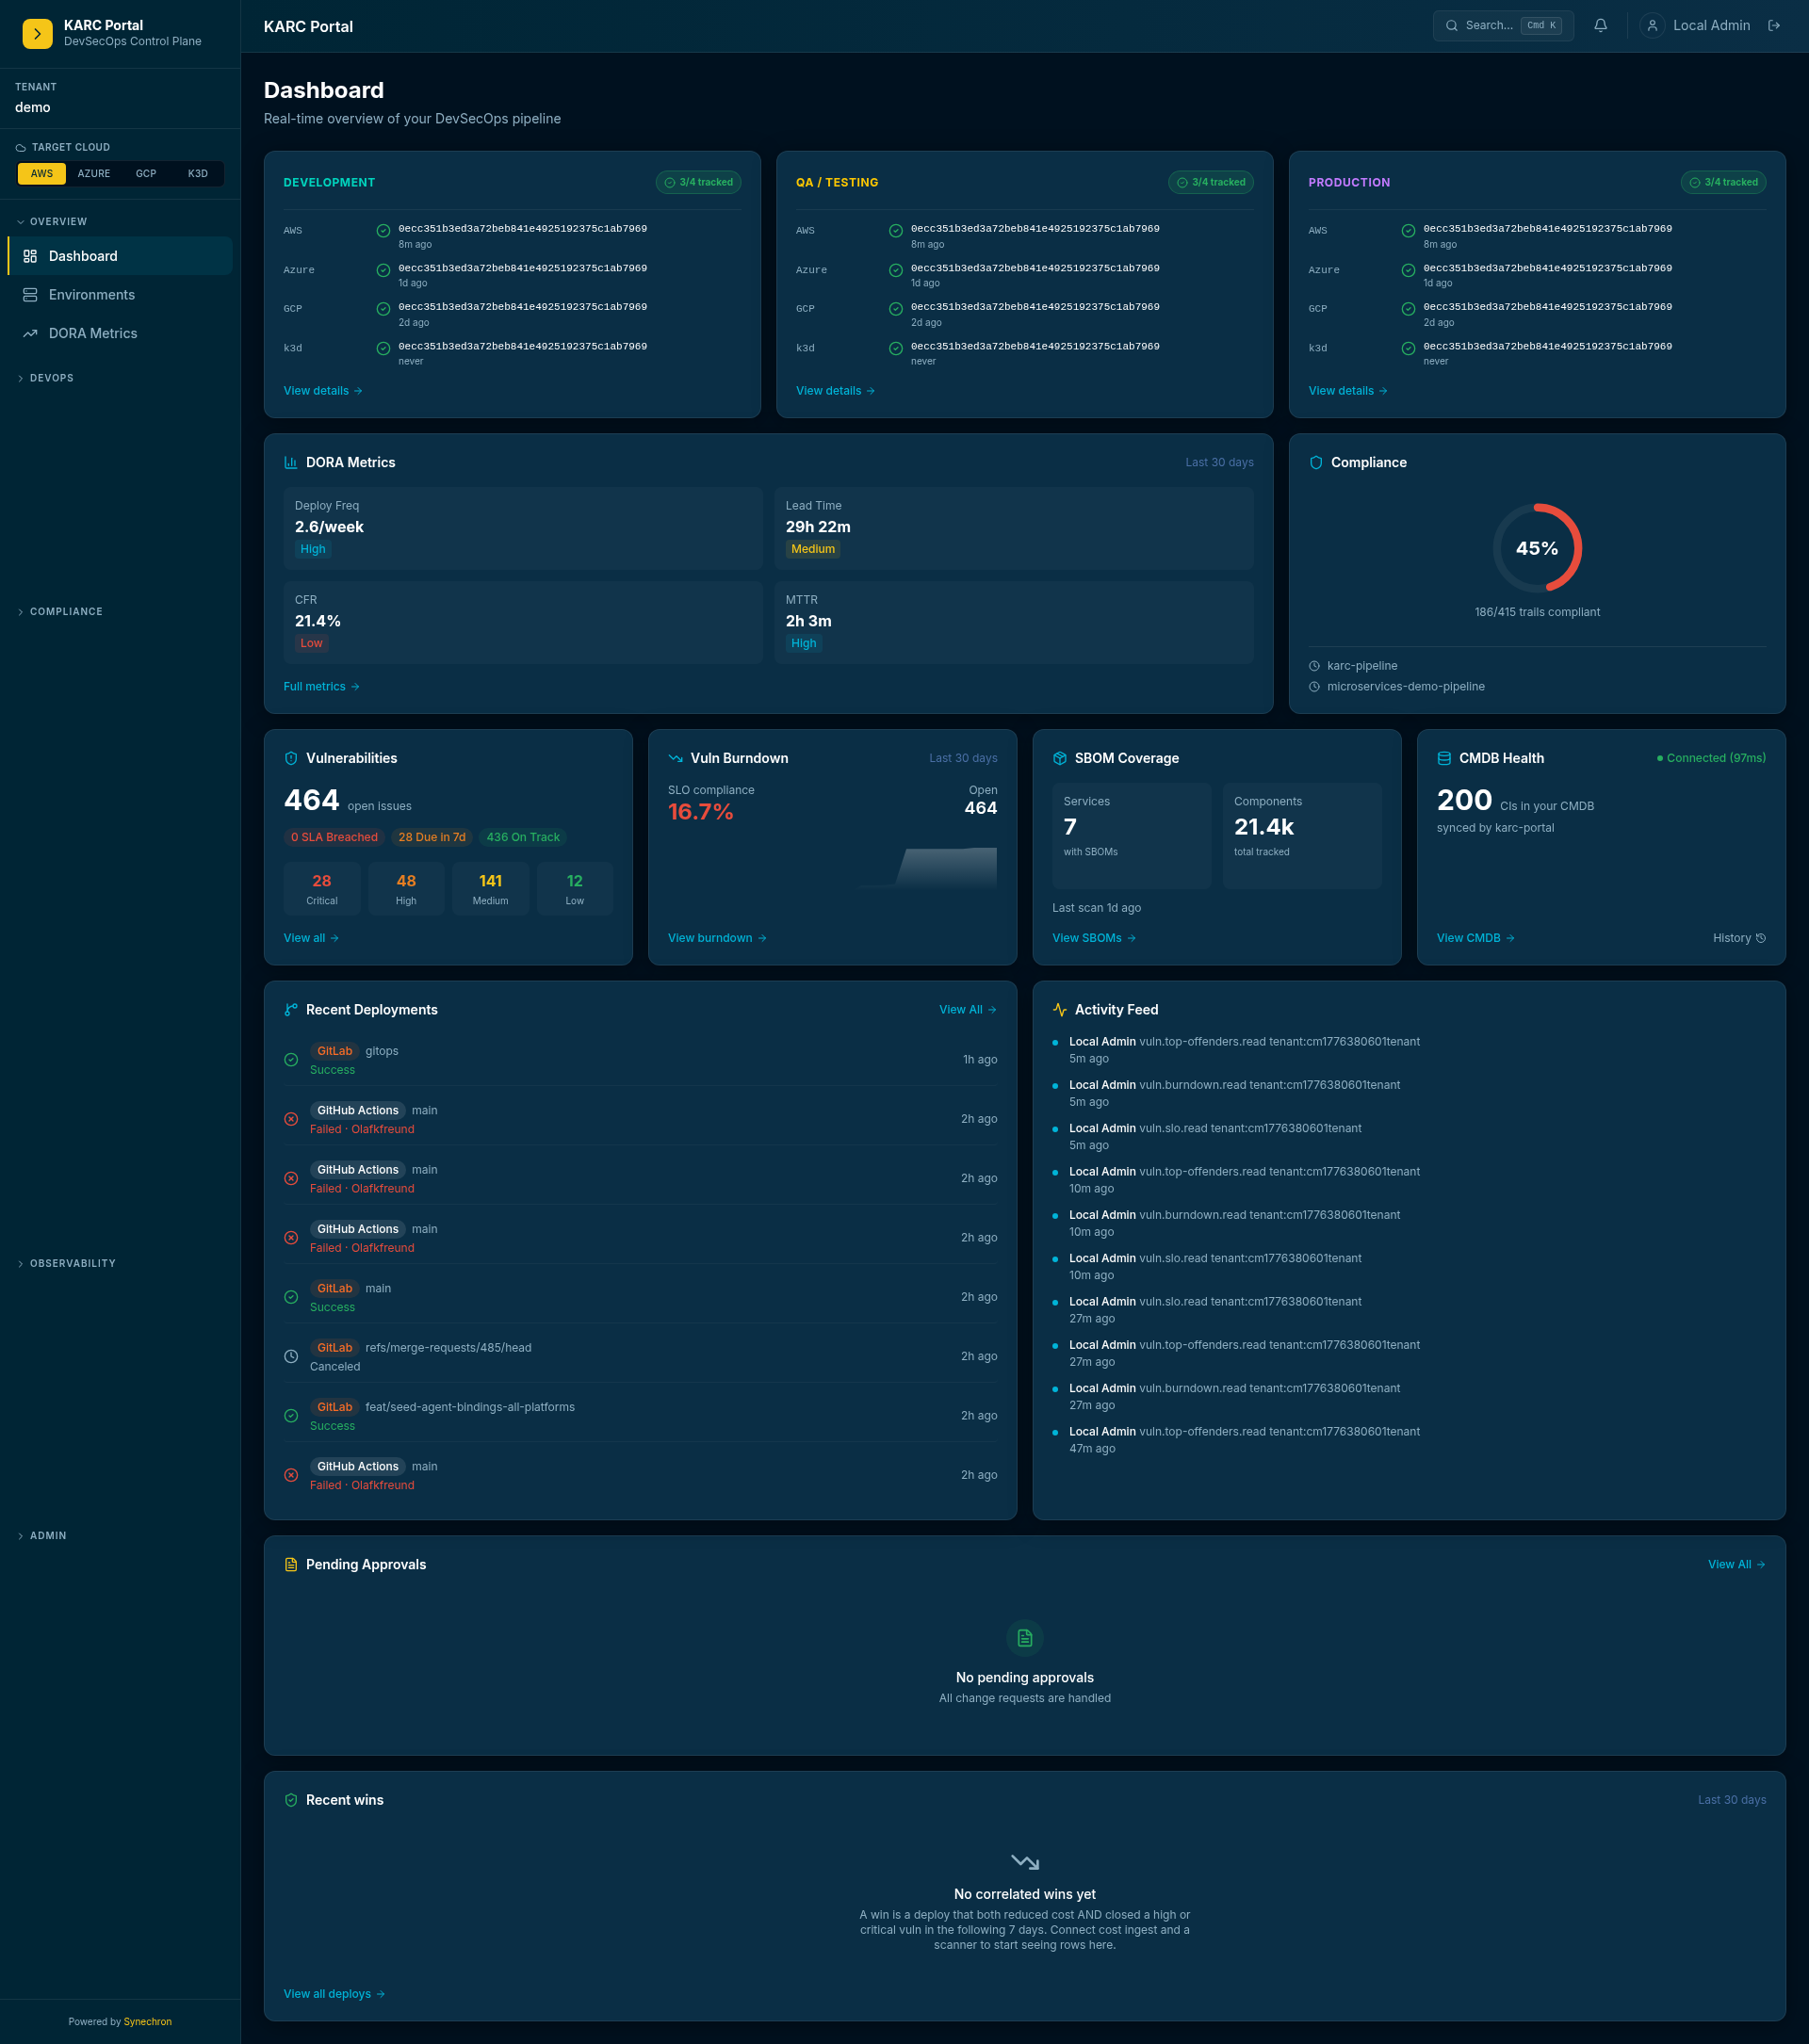
The dashboard
Section titled “The dashboard”The operator landing surface. KPI tiles for CR throughput, vuln backlog, evidence freshness, incident posture. Each tile click-throughs to its underlying detail view.
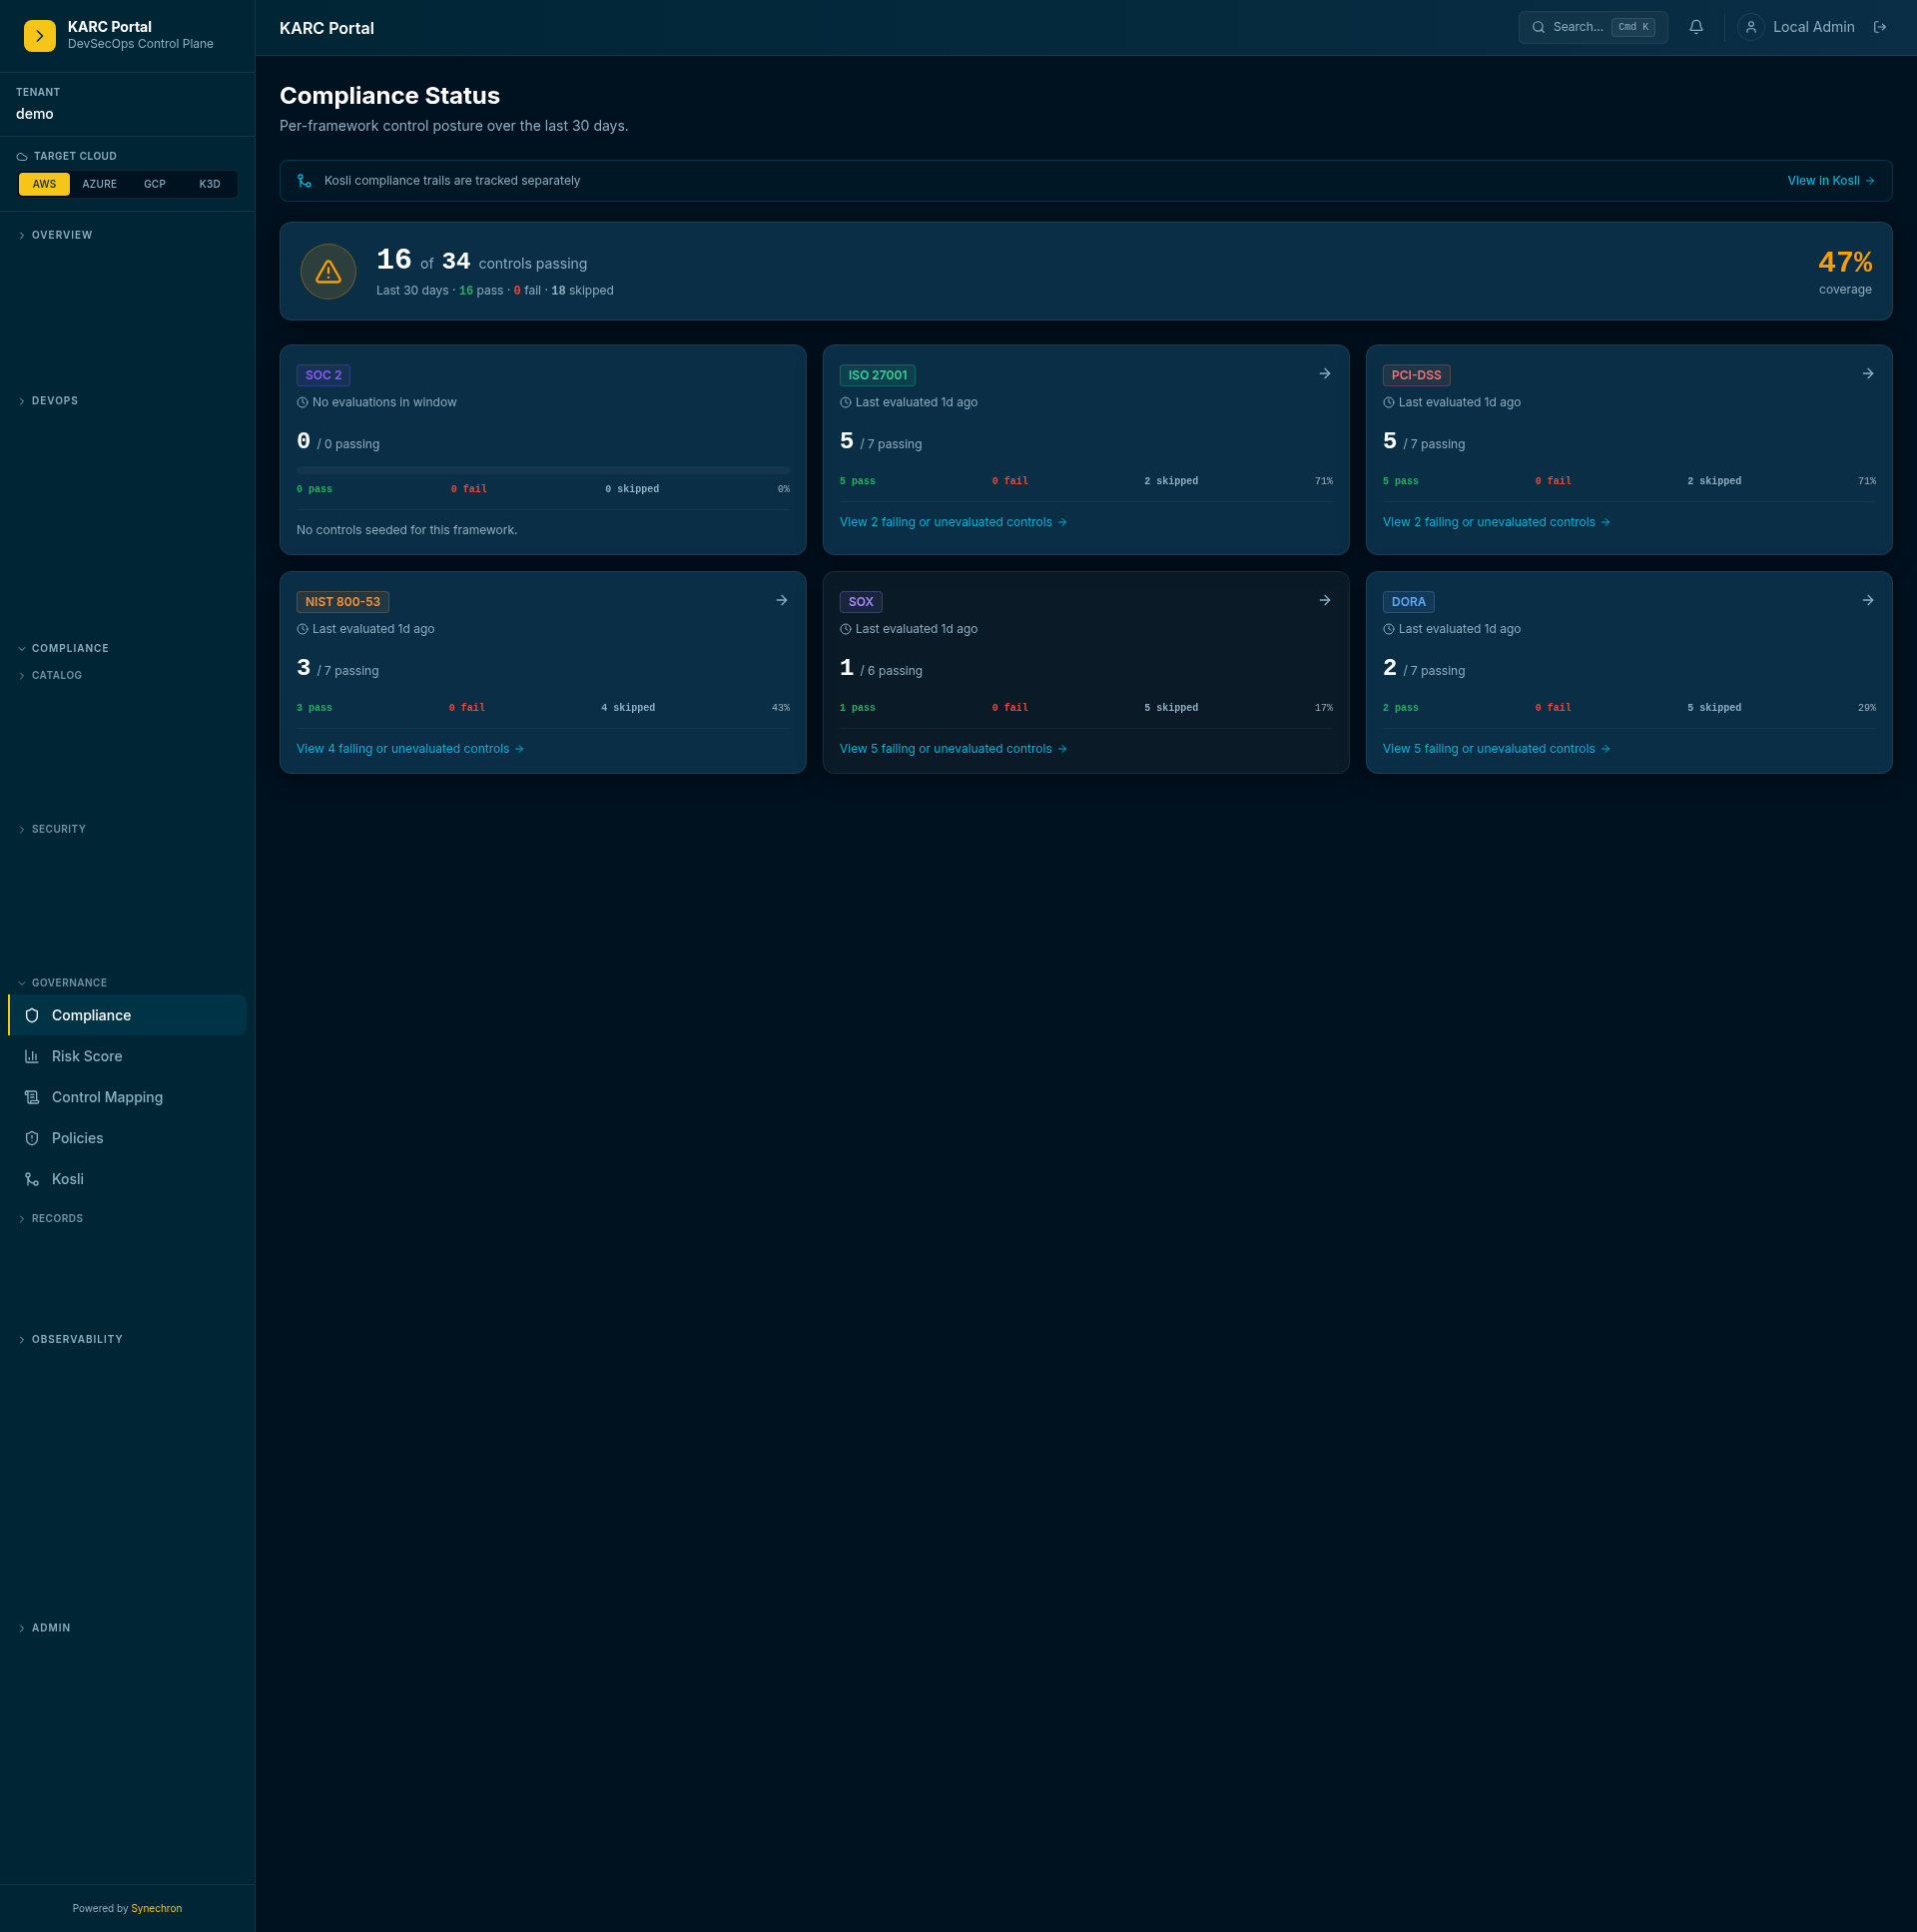
The compliance surface
Section titled “The compliance surface”Per-framework coverage cards, with drill-into-control + drill-into-evidence. The “evidence export” button at the top of the page renders a per-framework PDF pack for the chosen time window.
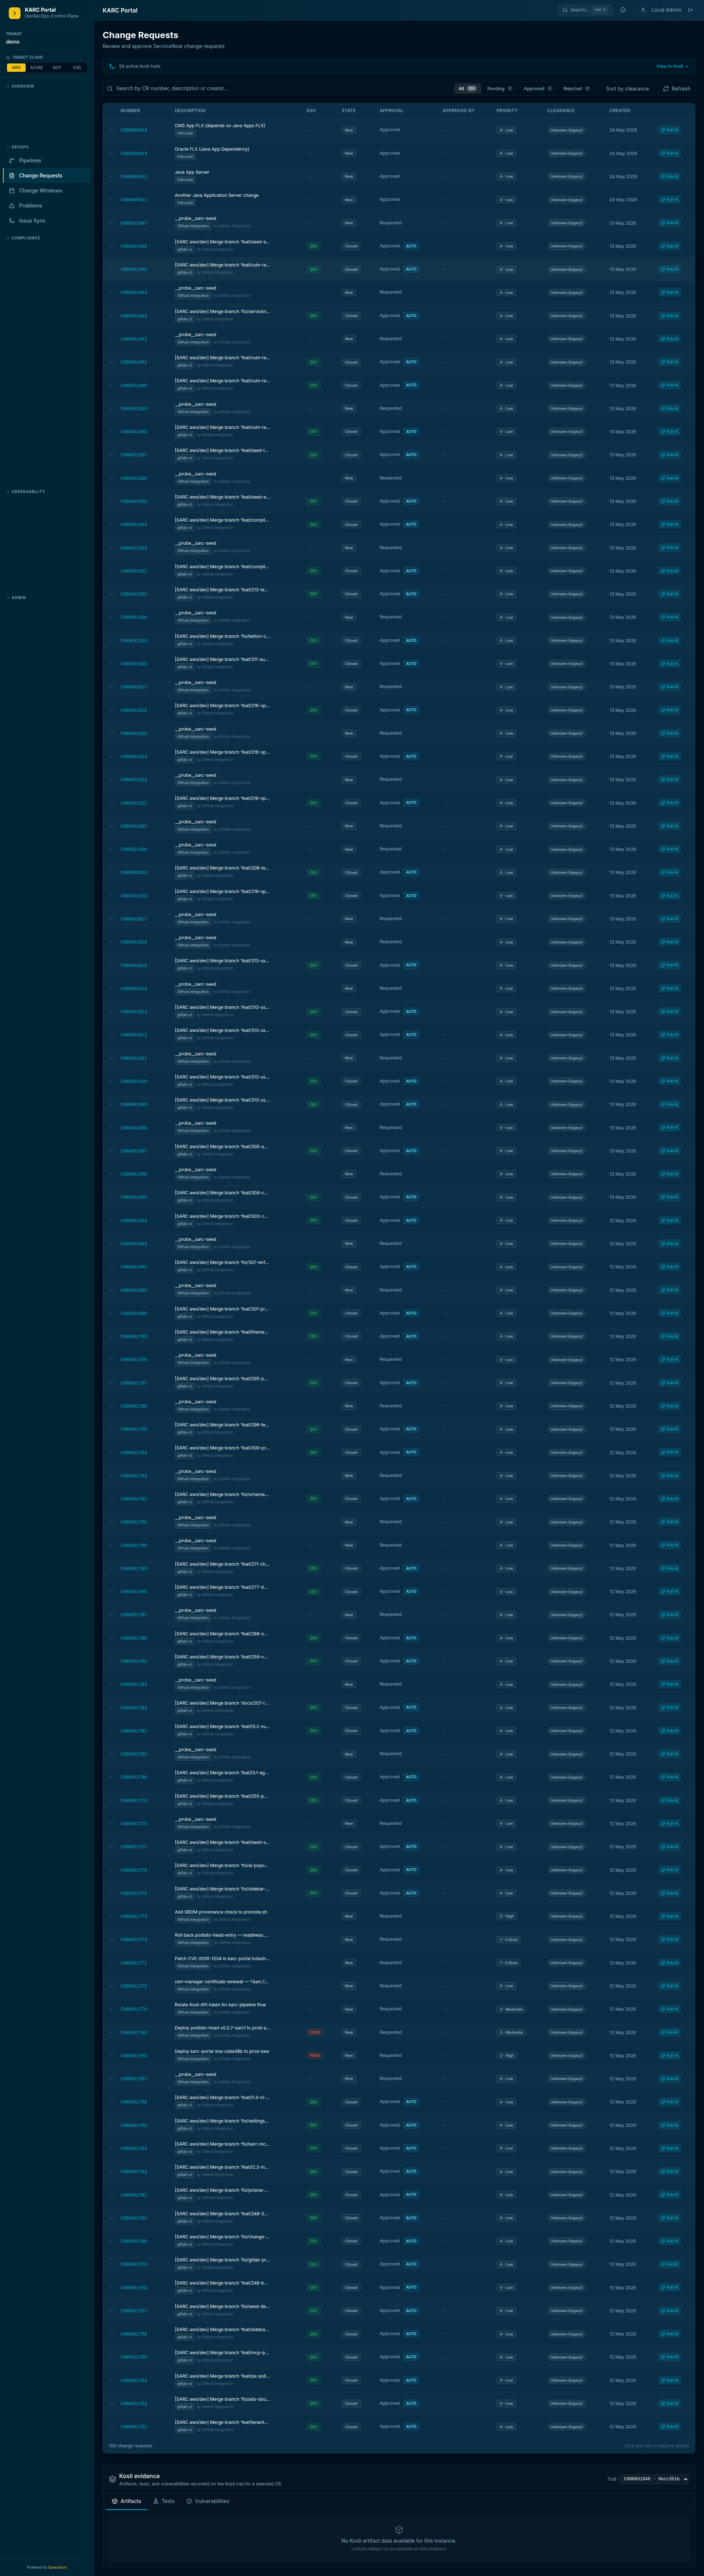
Change requests, enriched
Section titled “Change requests, enriched”ServiceNow CRs are mirrored here — but with the 5-axis risk score, SBOM, SARIF, and evidence trail link attached. The CAB chair stops compiling evidence manually because it’s already in the CR.
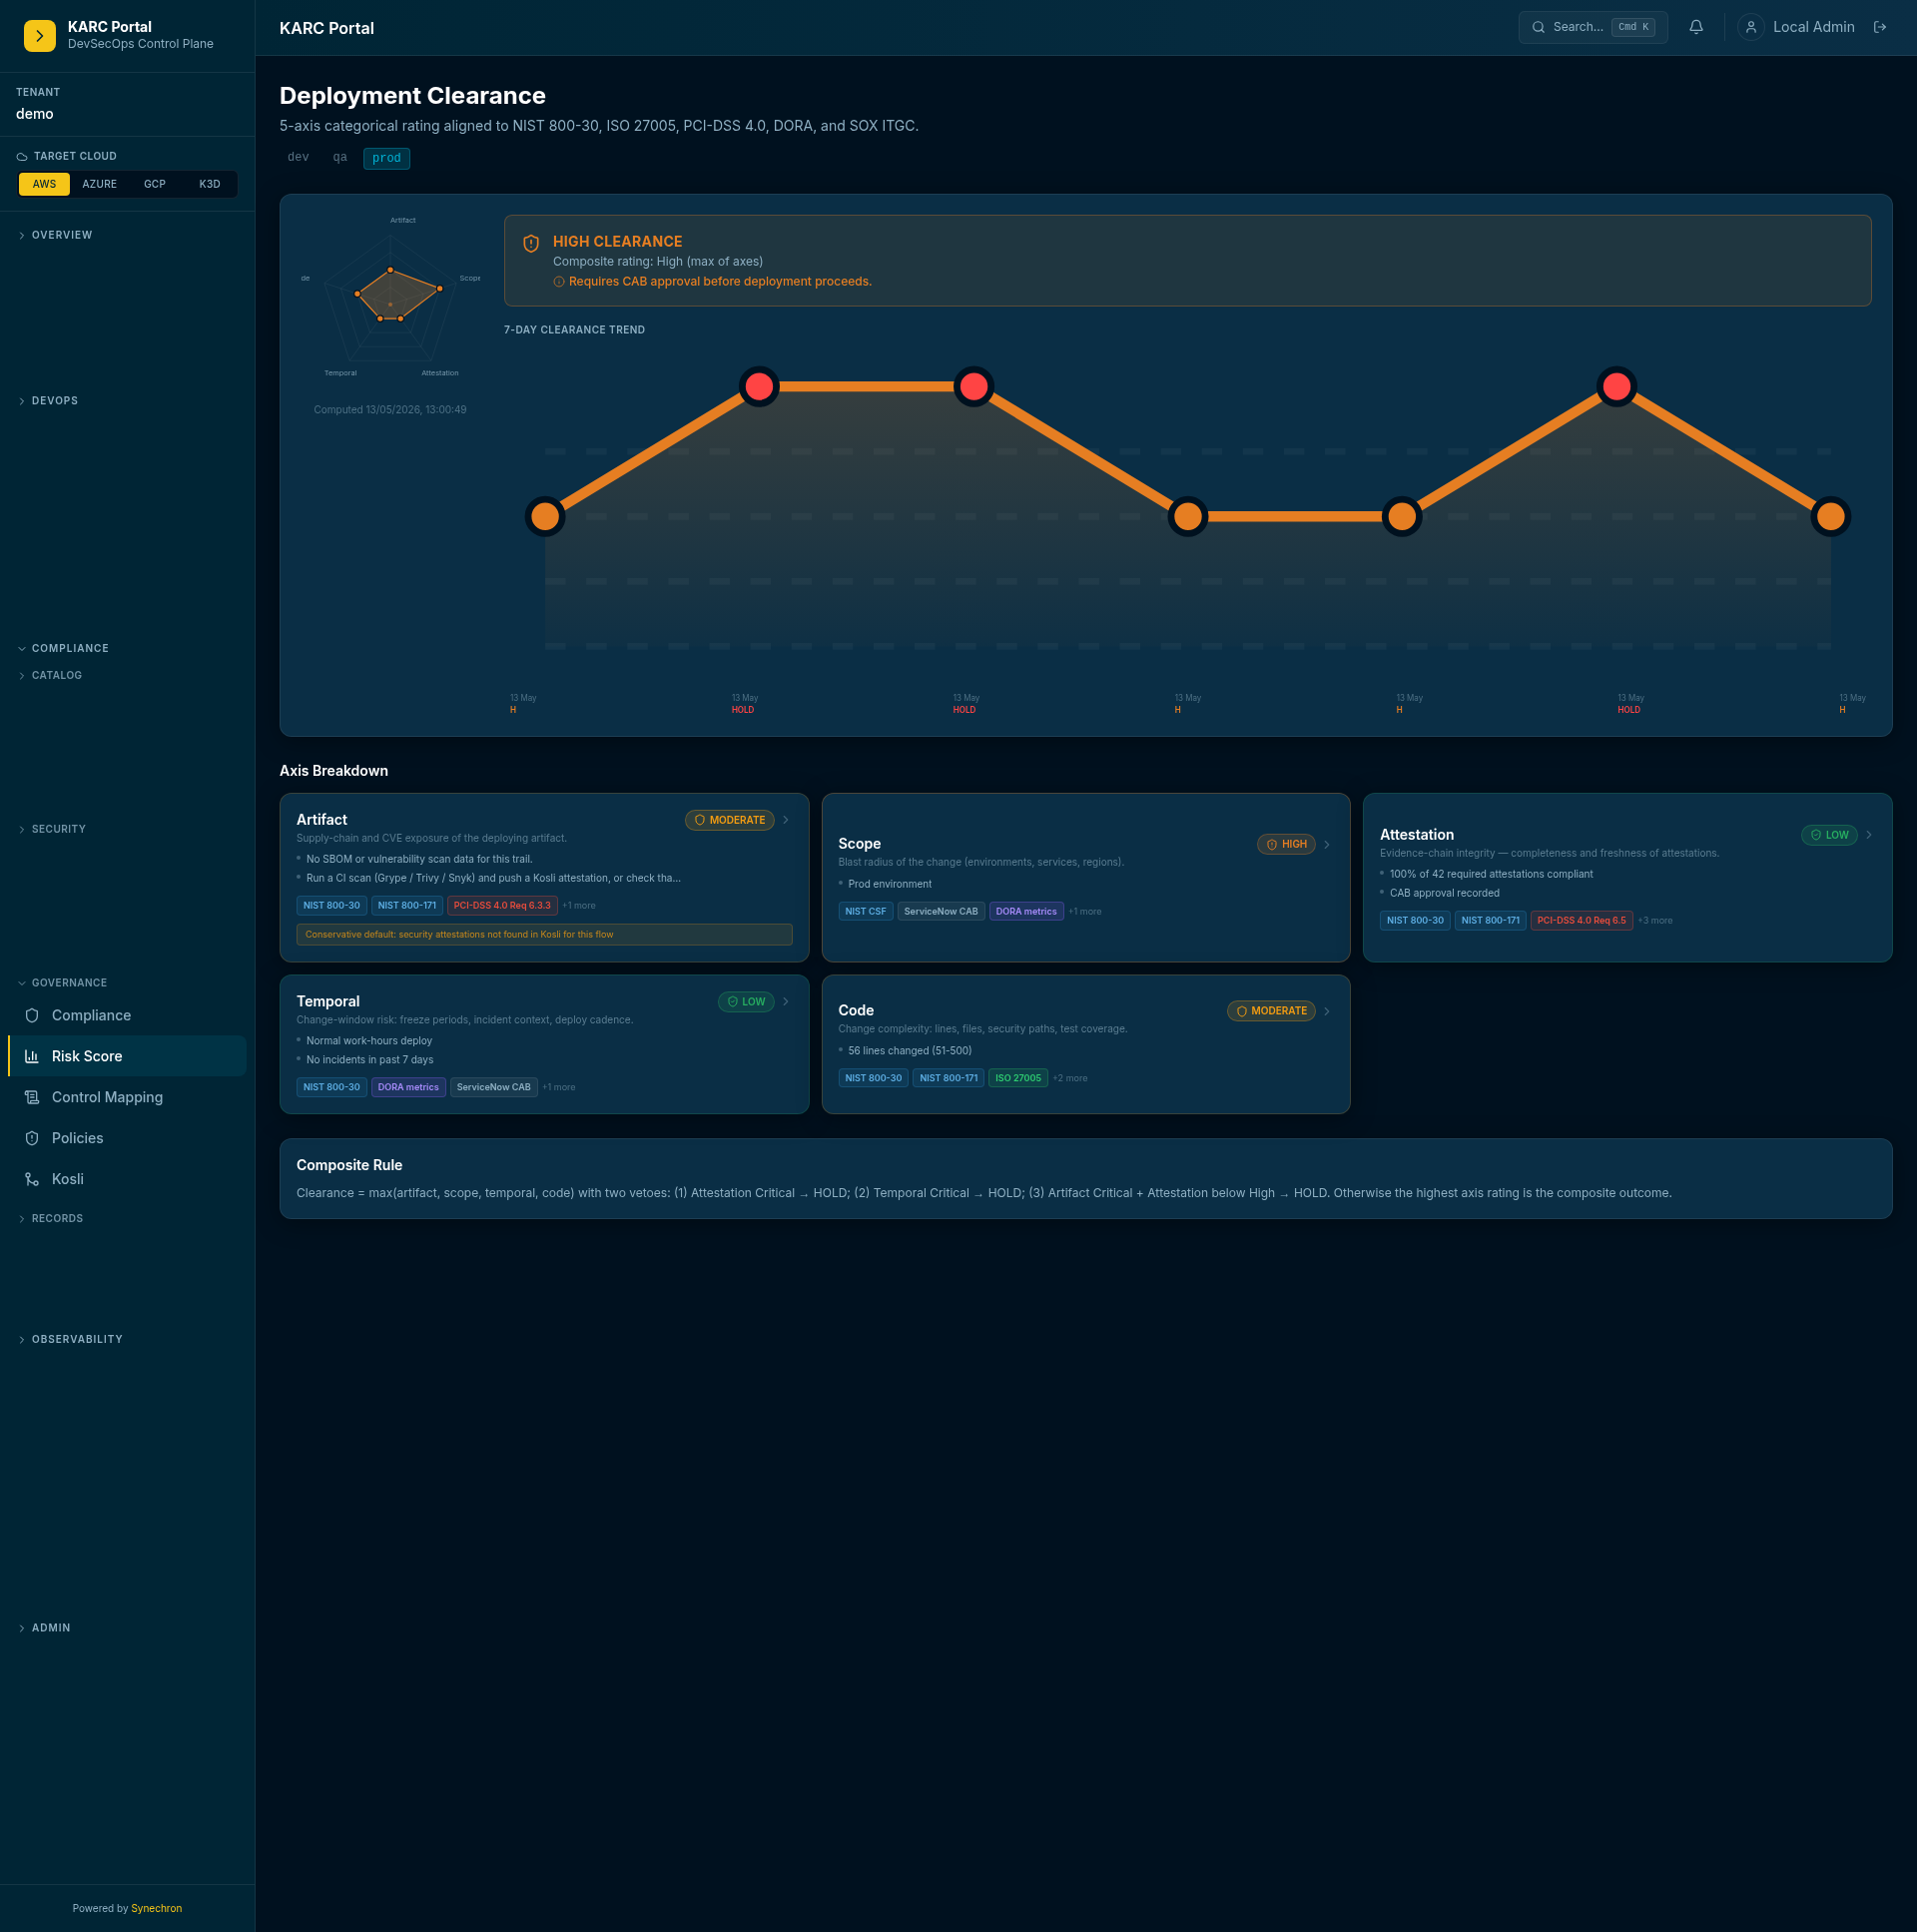
The 5-axis risk clearance score
Section titled “The 5-axis risk clearance score”Per CR. Five dimensions: change blast radius, vuln debt, evidence freshness, control coverage, behavioural pattern. The composite score is written back to the ServiceNow CR as a custom field.
How to use it — the three workflows that matter
Section titled “How to use it — the three workflows that matter”1. Approve (or block) a change
Section titled “1. Approve (or block) a change”The CAB chair’s workflow:
- Open
/change-requestsand find the change waiting for approval. - Scan the 5-axis risk score — anything yellow / red explains why a risk dimension is elevated.
- Click through to the underlying evidence trail to see the evidence behind the score.
- Approve in ServiceNow (the portal links out) or reject with a note.
What replaces what: the spreadsheet of “things to check before approving” is gone. The portal is the checklist.
2. Produce an audit-evidence pack
Section titled “2. Produce an audit-evidence pack”The compliance director’s workflow:
- Open
/compliance/evidence. - Pick the framework (SOC 2 / ISO 27001 / DORA / PSD2 / NIST 800-53 / PCI-DSS / SOX).
- Pick the time window (typically a quarter).
- Click “Export PDF” — the pack is rendered server-side and downloads as a single archive.
- Hand the archive to the auditor — or invite the auditor via magic-link for direct read-only access.
What replaces what: the quarter-end scramble across SonarQube, Snyk, ServiceNow attachments, and CI logs is gone. The pack is reproducible per-deployment, not compiled per-quarter.
3. Drive a vulnerability to closure
Section titled “3. Drive a vulnerability to closure”The platform engineer’s workflow:
- Open
/vulnerabilities. Filter by severity + SLA tier. - Click a row to open the drawer with CVE / NVD / OSV / GitLab / GitHub advisory links + the SBOM component + the cost-impact badge.
- If the agent recipe
vuln-suggest-fixis wired, click “Suggest fix” — the recipe drafts an MR in the right CI platform with the patch. - Approve the MR (still a human step); pipeline runs; the Evidence Vault attests the new evidence; vuln drops off the burndown.
What replaces what: the gap between “we found a vuln” and “someone is fixing it” — that gap is now one click instead of a Jira ticket round-trip.
Recently shipped capabilities
Section titled “Recently shipped capabilities”The portal has grown well beyond the dashboard. The capabilities below are live today:
- MCP-Client Gateway — propose-approve-execute write-actions to external systems (GitHub issues first) through an in-cluster MCP sidecar. ADMIN approval gate, an ADMIN-only
/admin/mcpoperator surface, and a full hash-chained audit log of every action. - Multi-provider AI + AskAi — bring your own model: Anthropic, Azure OpenAI, AWS Bedrock, Google Vertex, or on-prem. AskAi popovers on vulnerabilities, change requests, deployments, audit trails, and problems; natural-language search; and a read-only MCP server with portal tokens for external agents.
- Agent recipes — guided, flag-gated automations: vulnerability suggest-fix, problem investigate-fix, and right-sizing apply.
- Vulnerability workspace redesign — a 7-column table with a combined SLA cell, four priority KPI tiles, URL-persisted filters, and a per-row drawer linking CVE / NVD / OSV / GitLab + GitHub advisories, SBOM, evidence, cost-impact, and related Problems.
- Cost + chargeback — per-service cloud cost, per-team chargeback, right-sizing recommendations, and cost-vulnerability correlation under
/costs. - Auditor evidence export — one-button SOC 2 evidence pack, per-framework compliance status, control-evidence mapping, and a time-boxed AUDITOR login via magic-link invite.
- User administration — manual user creation, copy-once magic-link invites, CSV import, avatar upload, and the AUDITOR role.
- OpenShift CMDB sync — ClusterOperators, Routes, BuildConfigs, Builds, ImageStreams, and ImageStreamTags synced; a Build completion fires an attestation + ServiceNow change request.
- Tekton dashboard — live PipelineRun status over SSE with step-log streaming and an ADMIN-gated trigger.
- ArgoCD multi-cluster — sync status, SSE event stream, and log streaming across all three clouds; production auto-sync disabled by policy.
- Service graph — 23 mapped services spanning internal infra, the podtato microservice mesh, and external integrations.
- Operations — cloud + CI/CD lifecycle controls (pause, teardown, disable/enable per env); see Cloud + CI/CD lifecycle.
What it solves, in one paragraph
Section titled “What it solves, in one paragraph”The portal removes the compilation tax on regulated delivery. The data was always there — scattered. The portal collects it, correlates it, and gives every persona a single surface to do their job from. Compliance directors stop compiling evidence. CAB chairs stop compiling risk assessments. Auditors stop asking for evidence and start auditing it directly. Platform engineers stop being the human glue between scanners, ticket systems, and CI logs.
It is the operator surface, not a new system of record. The systems of record stay where they are.
Where to go next
Section titled “Where to go next”- Full portal tour — every operator screen, grouped by purpose
- Demo scripts — per-persona walkthroughs you can run live
- Architecture — the system shape that makes the portal work
- Getting started — bring this same portal up on your own cluster